 Tweet
Tweet
Too good not to share:
From the visual capitalist, the 700 year decline of interest rates.
------------------------------------------------------------------------------
Published 2 days ago on February 4, 2020
Visualizing the 700-Year Decline of Interest Rates
How far can interest rates fall?
Currently, many sovereign rates sit in negative territory, and there is an unprecedented $10 trillion in negative-yielding debt. This new interest rate climate has many observers wondering where the bottom truly lies.
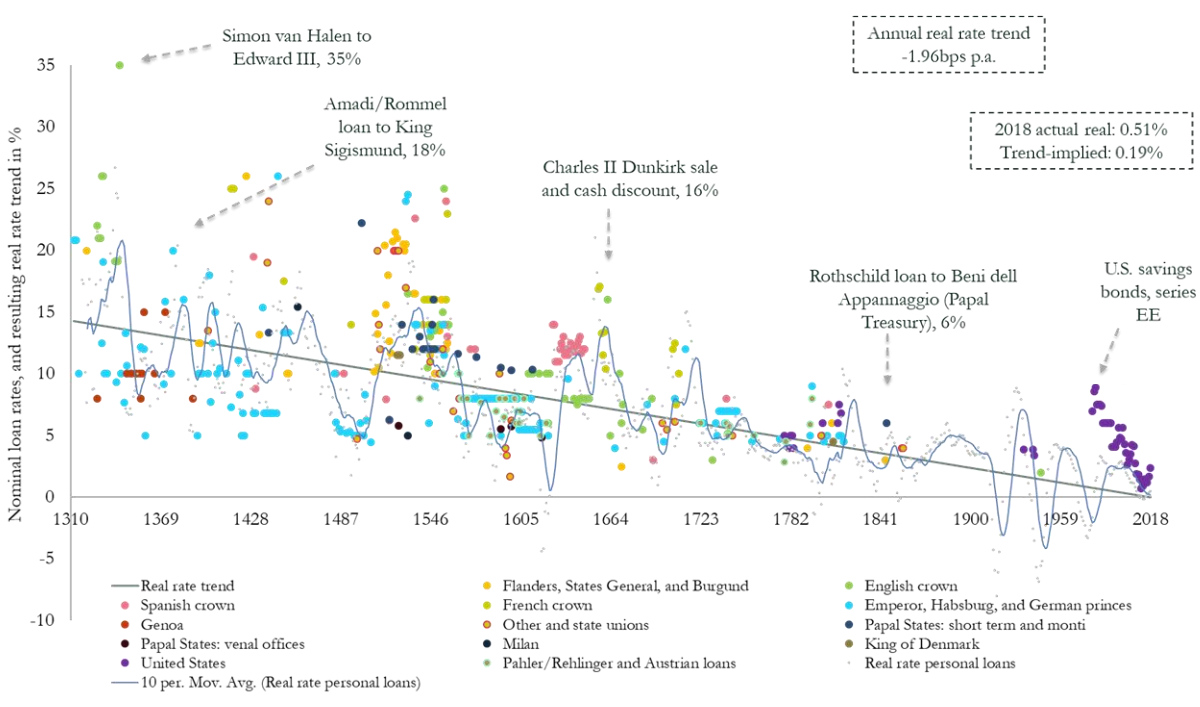
Today’s graphic from Paul Schmelzing, visiting scholar at the Bank of England (BOE), shows how global real interest rates have experienced an average annual decline of -0.0196% (-1.96 basis points) throughout the past eight centuries.
The Evidence on Falling Rates
Collecting data from across 78% of total advanced economy GDP over the time frame, Schmelzing shows that real rates* have witnessed a negative historical slope spanning back to the 1300s.
Displayed across the graph is a series of personal nominal loans made to sovereign establishments, along with their nominal loan rates. Some from the 14th century, for example, had nominal rates of 35%. By contrast, key nominal loan rates had fallen to 6% by the mid 1800s.
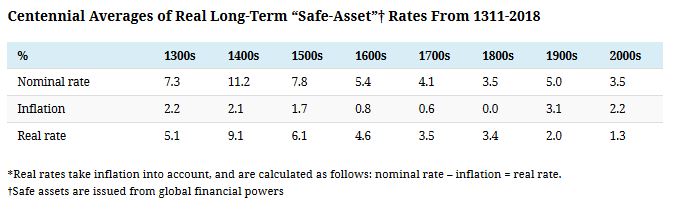
Starting in 1311, data from the report shows how average real rates moved from 5.1% in the 1300s down to an average of 2% in the 1900s.
The average real rate between 2000-2018 stands at 1.3%.
--------------------------------------------------------------------------------------------------------------------------------------
Rest of article is => here. Recommended read if you get a chance.
From the visual capitalist, the 700 year decline of interest rates.
------------------------------------------------------------------------------
Published 2 days ago on February 4, 2020
Visualizing the 700-Year Decline of Interest Rates
How far can interest rates fall?
Currently, many sovereign rates sit in negative territory, and there is an unprecedented $10 trillion in negative-yielding debt. This new interest rate climate has many observers wondering where the bottom truly lies.
Today’s graphic from Paul Schmelzing, visiting scholar at the Bank of England (BOE), shows how global real interest rates have experienced an average annual decline of -0.0196% (-1.96 basis points) throughout the past eight centuries.
The Evidence on Falling Rates
Collecting data from across 78% of total advanced economy GDP over the time frame, Schmelzing shows that real rates* have witnessed a negative historical slope spanning back to the 1300s.
Displayed across the graph is a series of personal nominal loans made to sovereign establishments, along with their nominal loan rates. Some from the 14th century, for example, had nominal rates of 35%. By contrast, key nominal loan rates had fallen to 6% by the mid 1800s.
Starting in 1311, data from the report shows how average real rates moved from 5.1% in the 1300s down to an average of 2% in the 1900s.
The average real rate between 2000-2018 stands at 1.3%.
--------------------------------------------------------------------------------------------------------------------------------------
Rest of article is => here. Recommended read if you get a chance.
Comment